Algorithm Impact Tracker [Full Guide]
How to Use the Algorithm Impact Tracker
Google changes its search algorithm constantly – sometimes with big, named “core updates,” sometimes with quieter tweaks. When your rankings or traffic move, the first question is always “was that me, or was that Google?” The Algorithm Impact Tracker exists to answer that. It records every confirmed Google update since 2023, measures how turbulent the search results were around each one, and shows which industries got hit hardest – so you can tell the difference between a problem on your site and a shift in the whole search landscape. This guide explains every card, chart and tab.
Open the Algorithm Tracker
First, what “volatility” means
The word appears all over this tool, so it’s worth understanding. Volatility is a measure of how much rankings are moving around across the web on a given day, scored out of 100. Low volatility means the results are calm and stable. High volatility means lots of pages are jumping up and down in the rankings – which usually signals that Google is rolling something out. Think of it like a weather reading for search: a calm day versus a storm. When your own rankings change on a high-volatility day, that’s a strong hint the cause was Google, not you.
1. The four summary cards at the top
Before the tabs, four cards give you the headline picture at a glance:
- Total updates – how many confirmed updates there have been since January 2023. A quick sense of how active Google has been.
- High / Very high impact – how many of those were the big, disruptive ones, as opposed to minor tweaks. This tells you how many were worth worrying about.
- Current volatility – how unstable the results are today, scored out of 100, with a plain-language label such as “Low,” “Moderate” or “High volatility.” This is your live “is something happening right now?” gauge.
- Last update – the date and name of the most recent confirmed update, so you always know the latest event to check your data against.

2. Tab 1 – Volatility Charts
This is the tab you land on. It contains three charts that together show the pattern of turbulence over time.
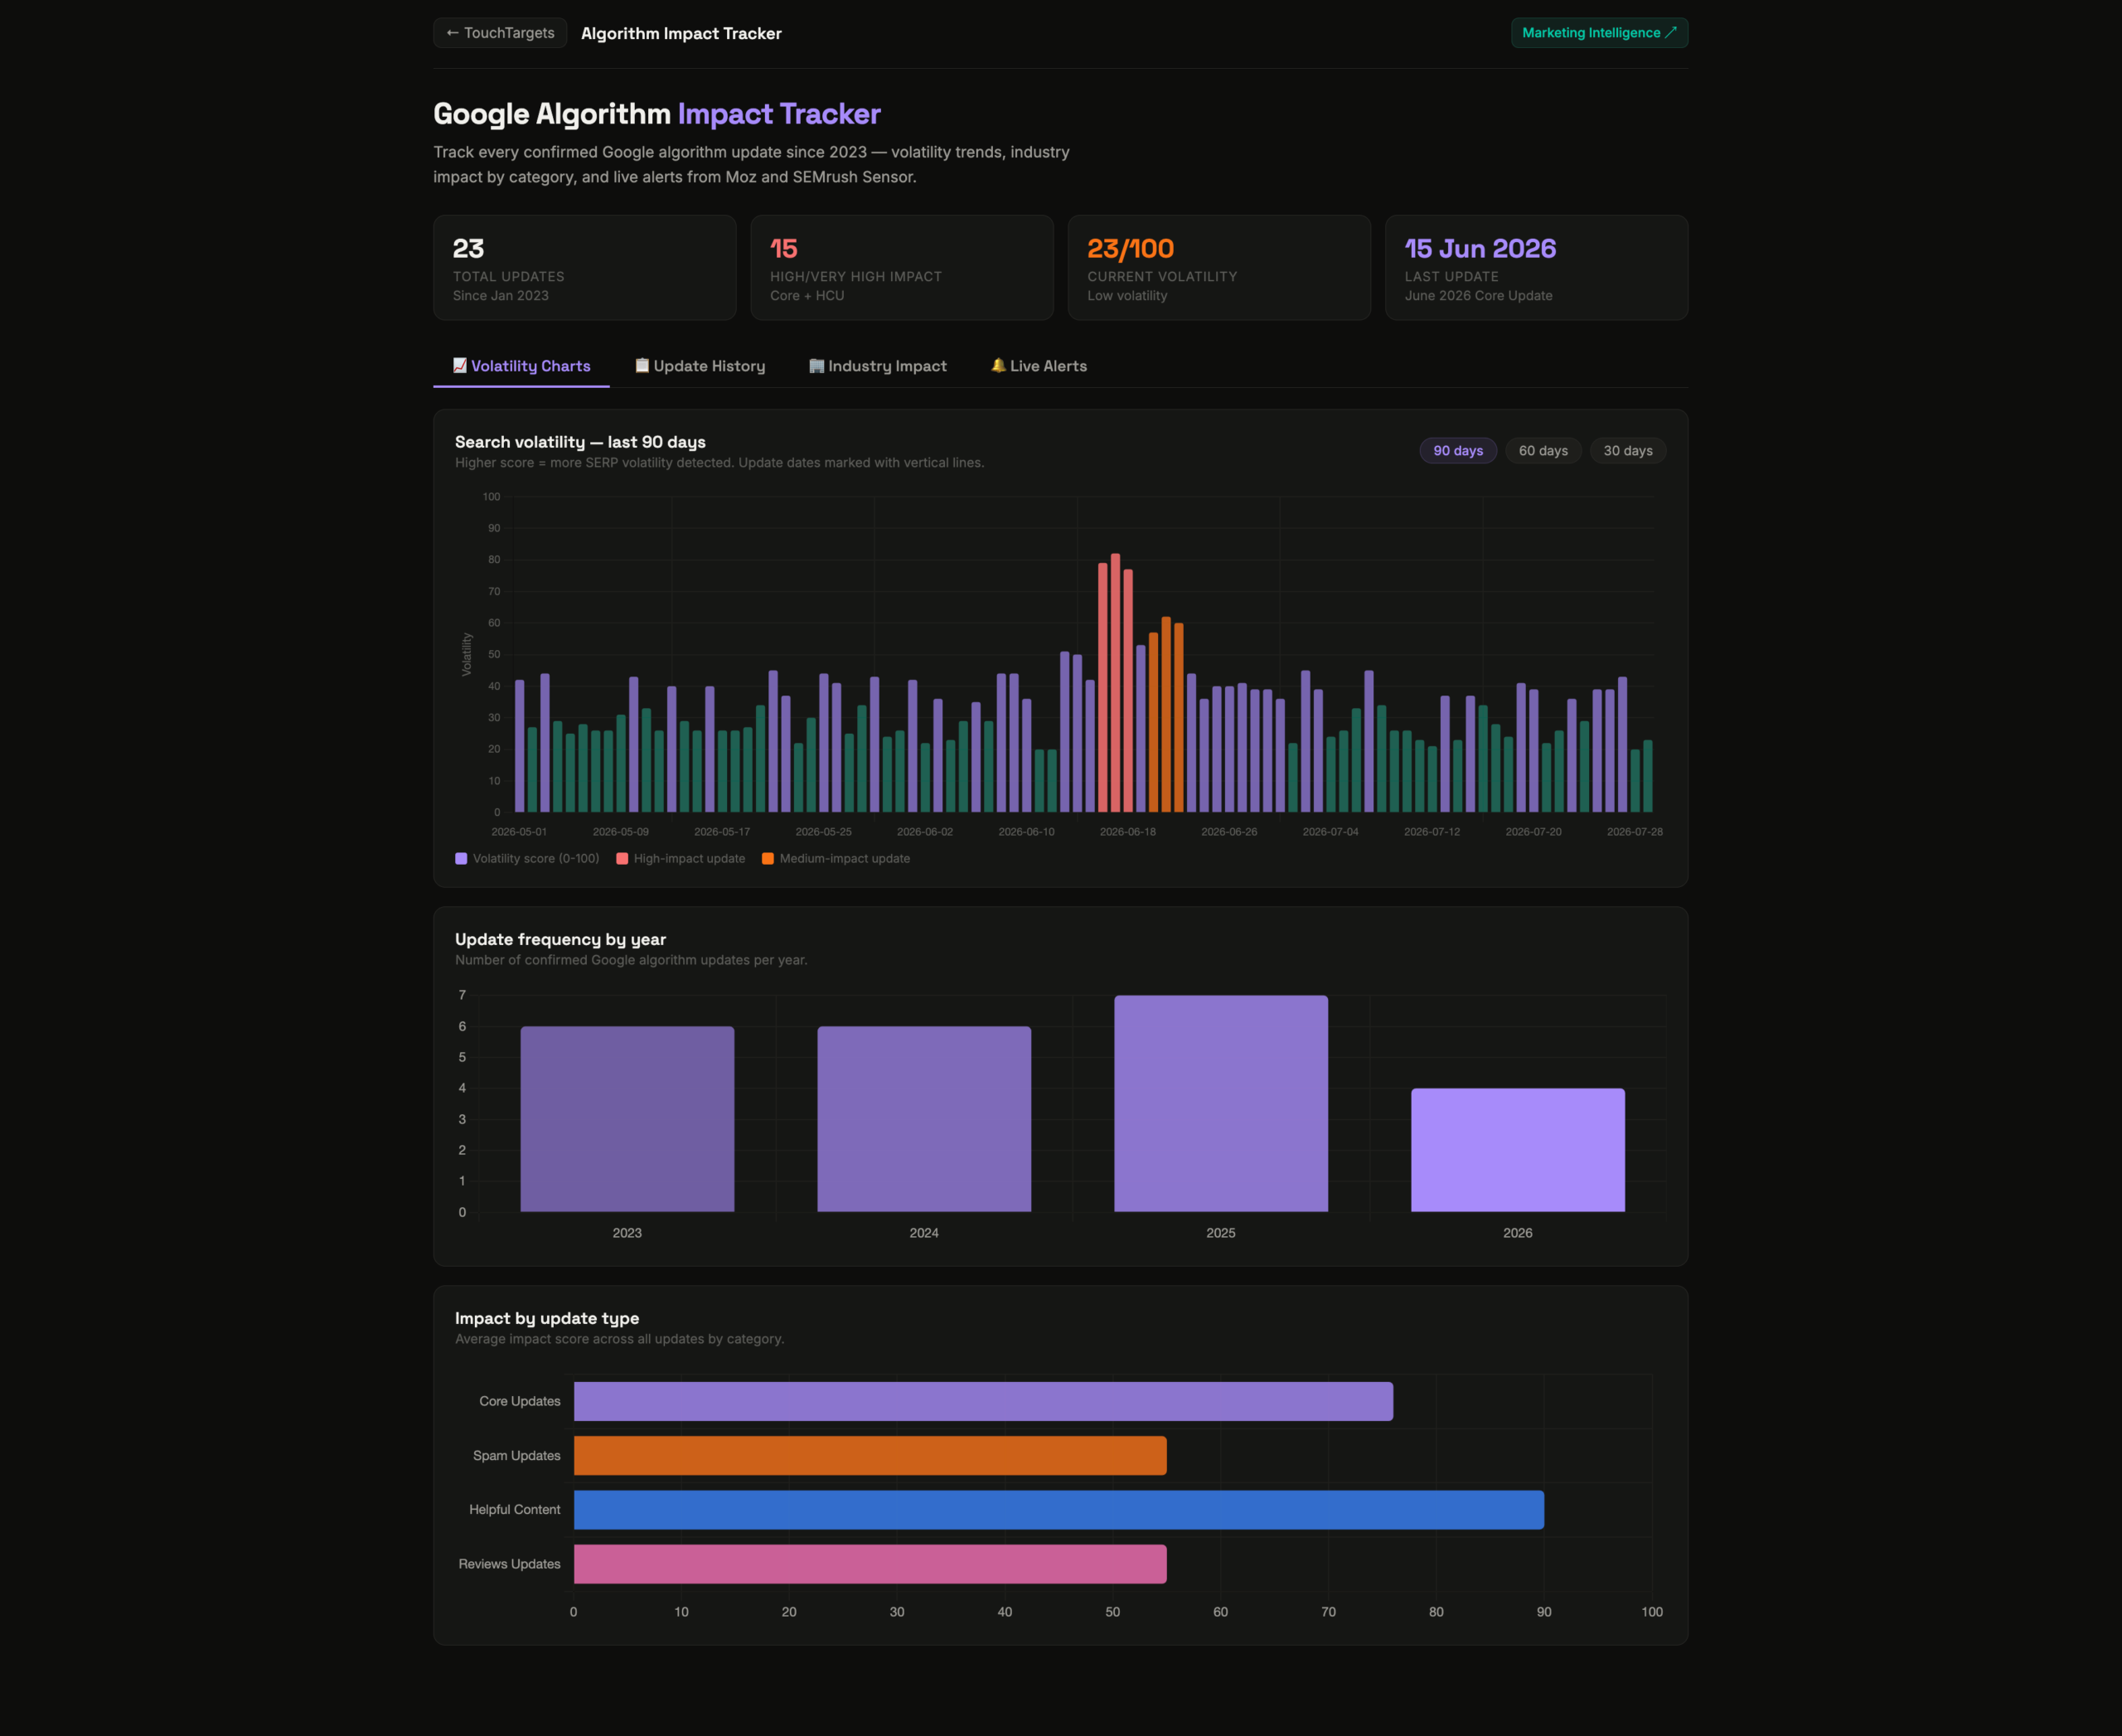
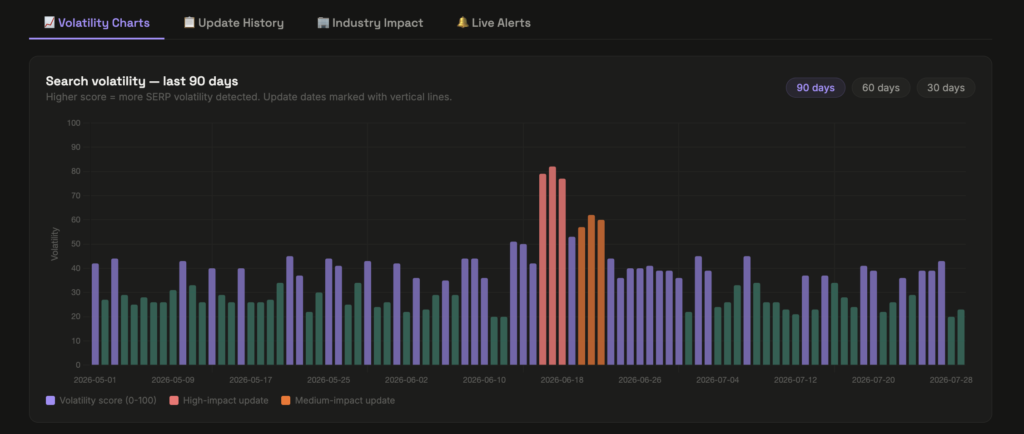
Search volatility (last 90 days)
The main chart. Each bar is one day; the taller and redder the bar, the more turbulent the results were that day. Calm periods sit low and green. This is where you look first when diagnosing a traffic change – find the date, look at the bar.
- Use the 90 days / 60 days / 30 days buttons in the corner to zoom the window in or out. Thirty days is best for a recent change; ninety gives you the longer trend.
- Hover over any bar to see the exact volatility score for that specific day.
- Tall spikes usually line up with named updates – cross-reference them with the Update History tab.
Update frequency by year
A simple bar per year showing how many confirmed updates Google shipped. Over time this reveals whether the pace of change is accelerating – useful context for how often you should be checking in.
Impact by update type
Shows the average severity of each kind of update – Core, Spam, Helpful Content and Reviews. It answers “which types of update tend to hurt the most?” so you know which announcements to take most seriously when they’re rolling out.
3. Tab 2 – Update History
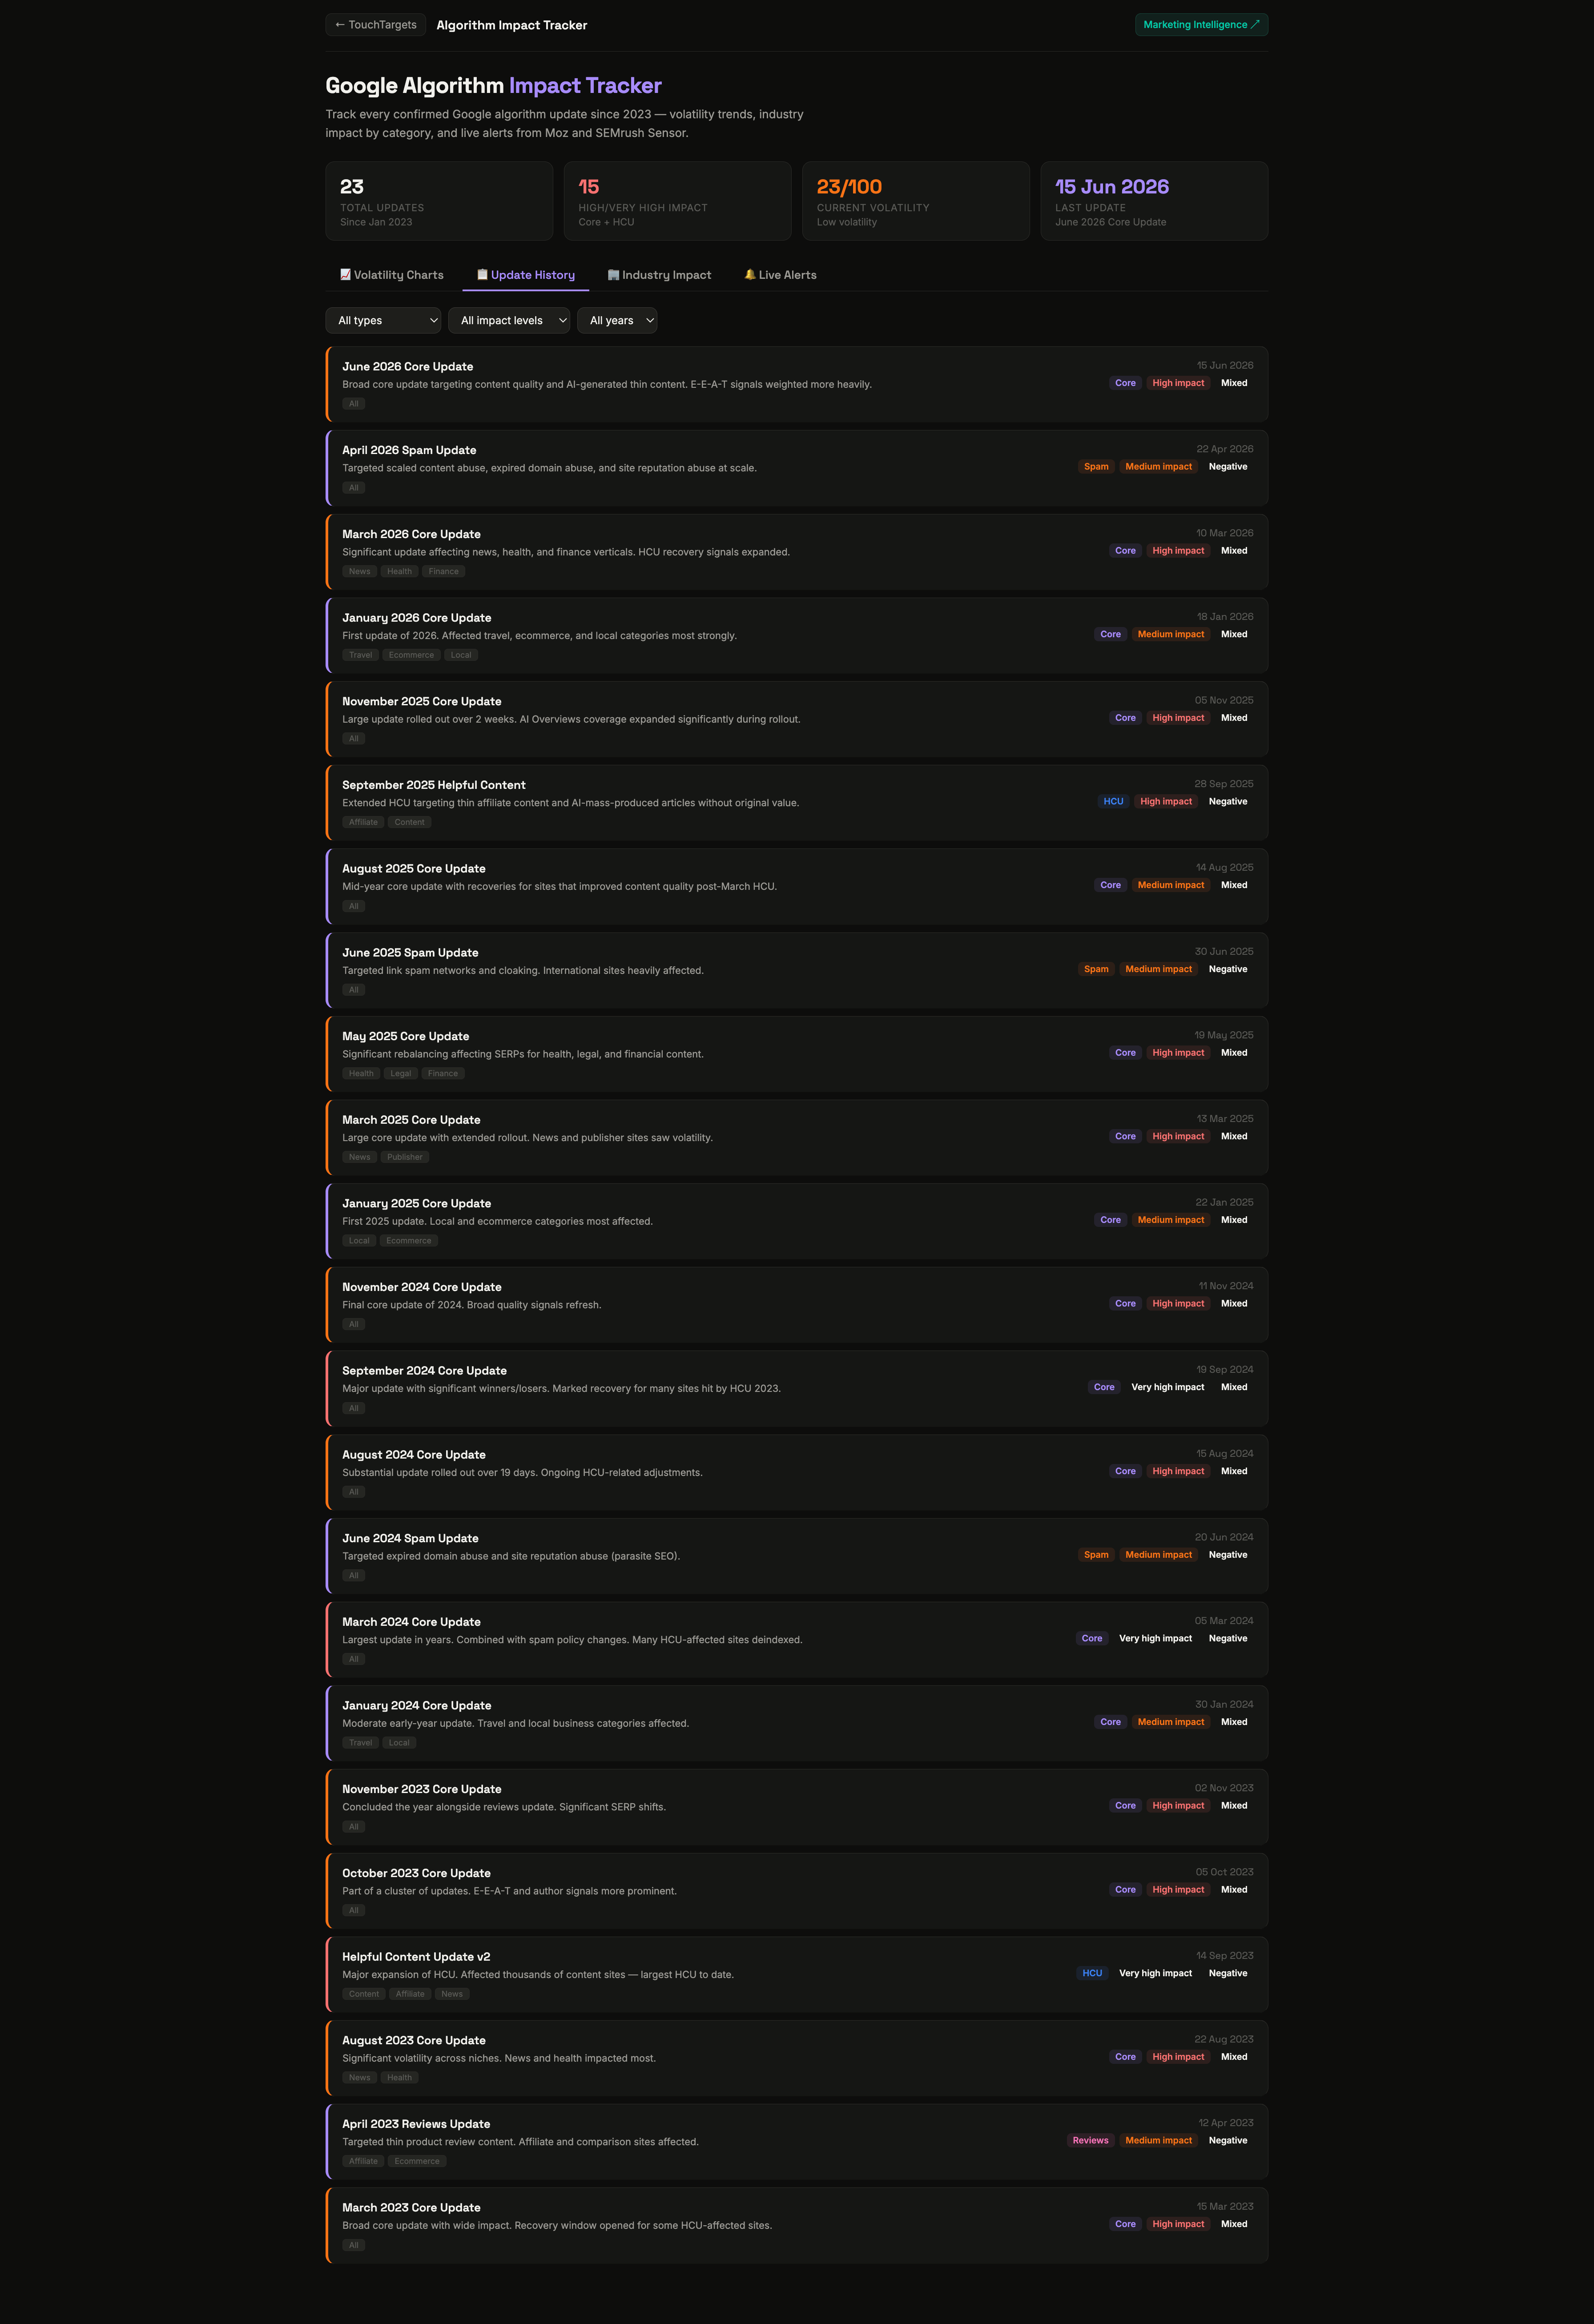
This is the full, searchable record of every confirmed update. Three dropdowns at the top let you narrow the list:
- Type – Core, Spam, Helpful Content, or Reviews (explained below).
- Impact level – Very high, High, or Medium.
- Year – 2023 through 2026.
Each update is shown as a card containing its date, a short plain-language description of what it did, and three coloured badges:
- Type – what kind of update it was.
- Impact – how disruptive it was overall.
- Direction – whether it generally pushed rankings up (positive), down (negative), or a mix of both (mixed).
Beneath each card are the content categories it most affected. This is your reference library: when a spike shows up in the volatility chart, come here, filter to that year, and read what actually happened.
The update types, explained
- Core update – a broad, sweeping change to how Google ranks everything. These cause the biggest movements and can’t be “fixed” with one tweak; they reward overall quality.
- Spam update – targets manipulative or low-quality tactics (link spam, thin auto-generated content). If you play clean, these usually help you.
- Helpful Content – rewards content genuinely written for people over content written to rank. Thin, filler pages tend to lose.
- Reviews update – specifically affects product-review and recommendation content, rewarding first-hand, in-depth reviews.
The impact levels
Very high and High are the updates that move the search landscape meaningfully – the ones to watch closely. Medium updates cause smaller ripples. Knowing the level helps you judge whether a ranking change was likely tied to that update or just noise.
4. Tab 3 – Industry Impact
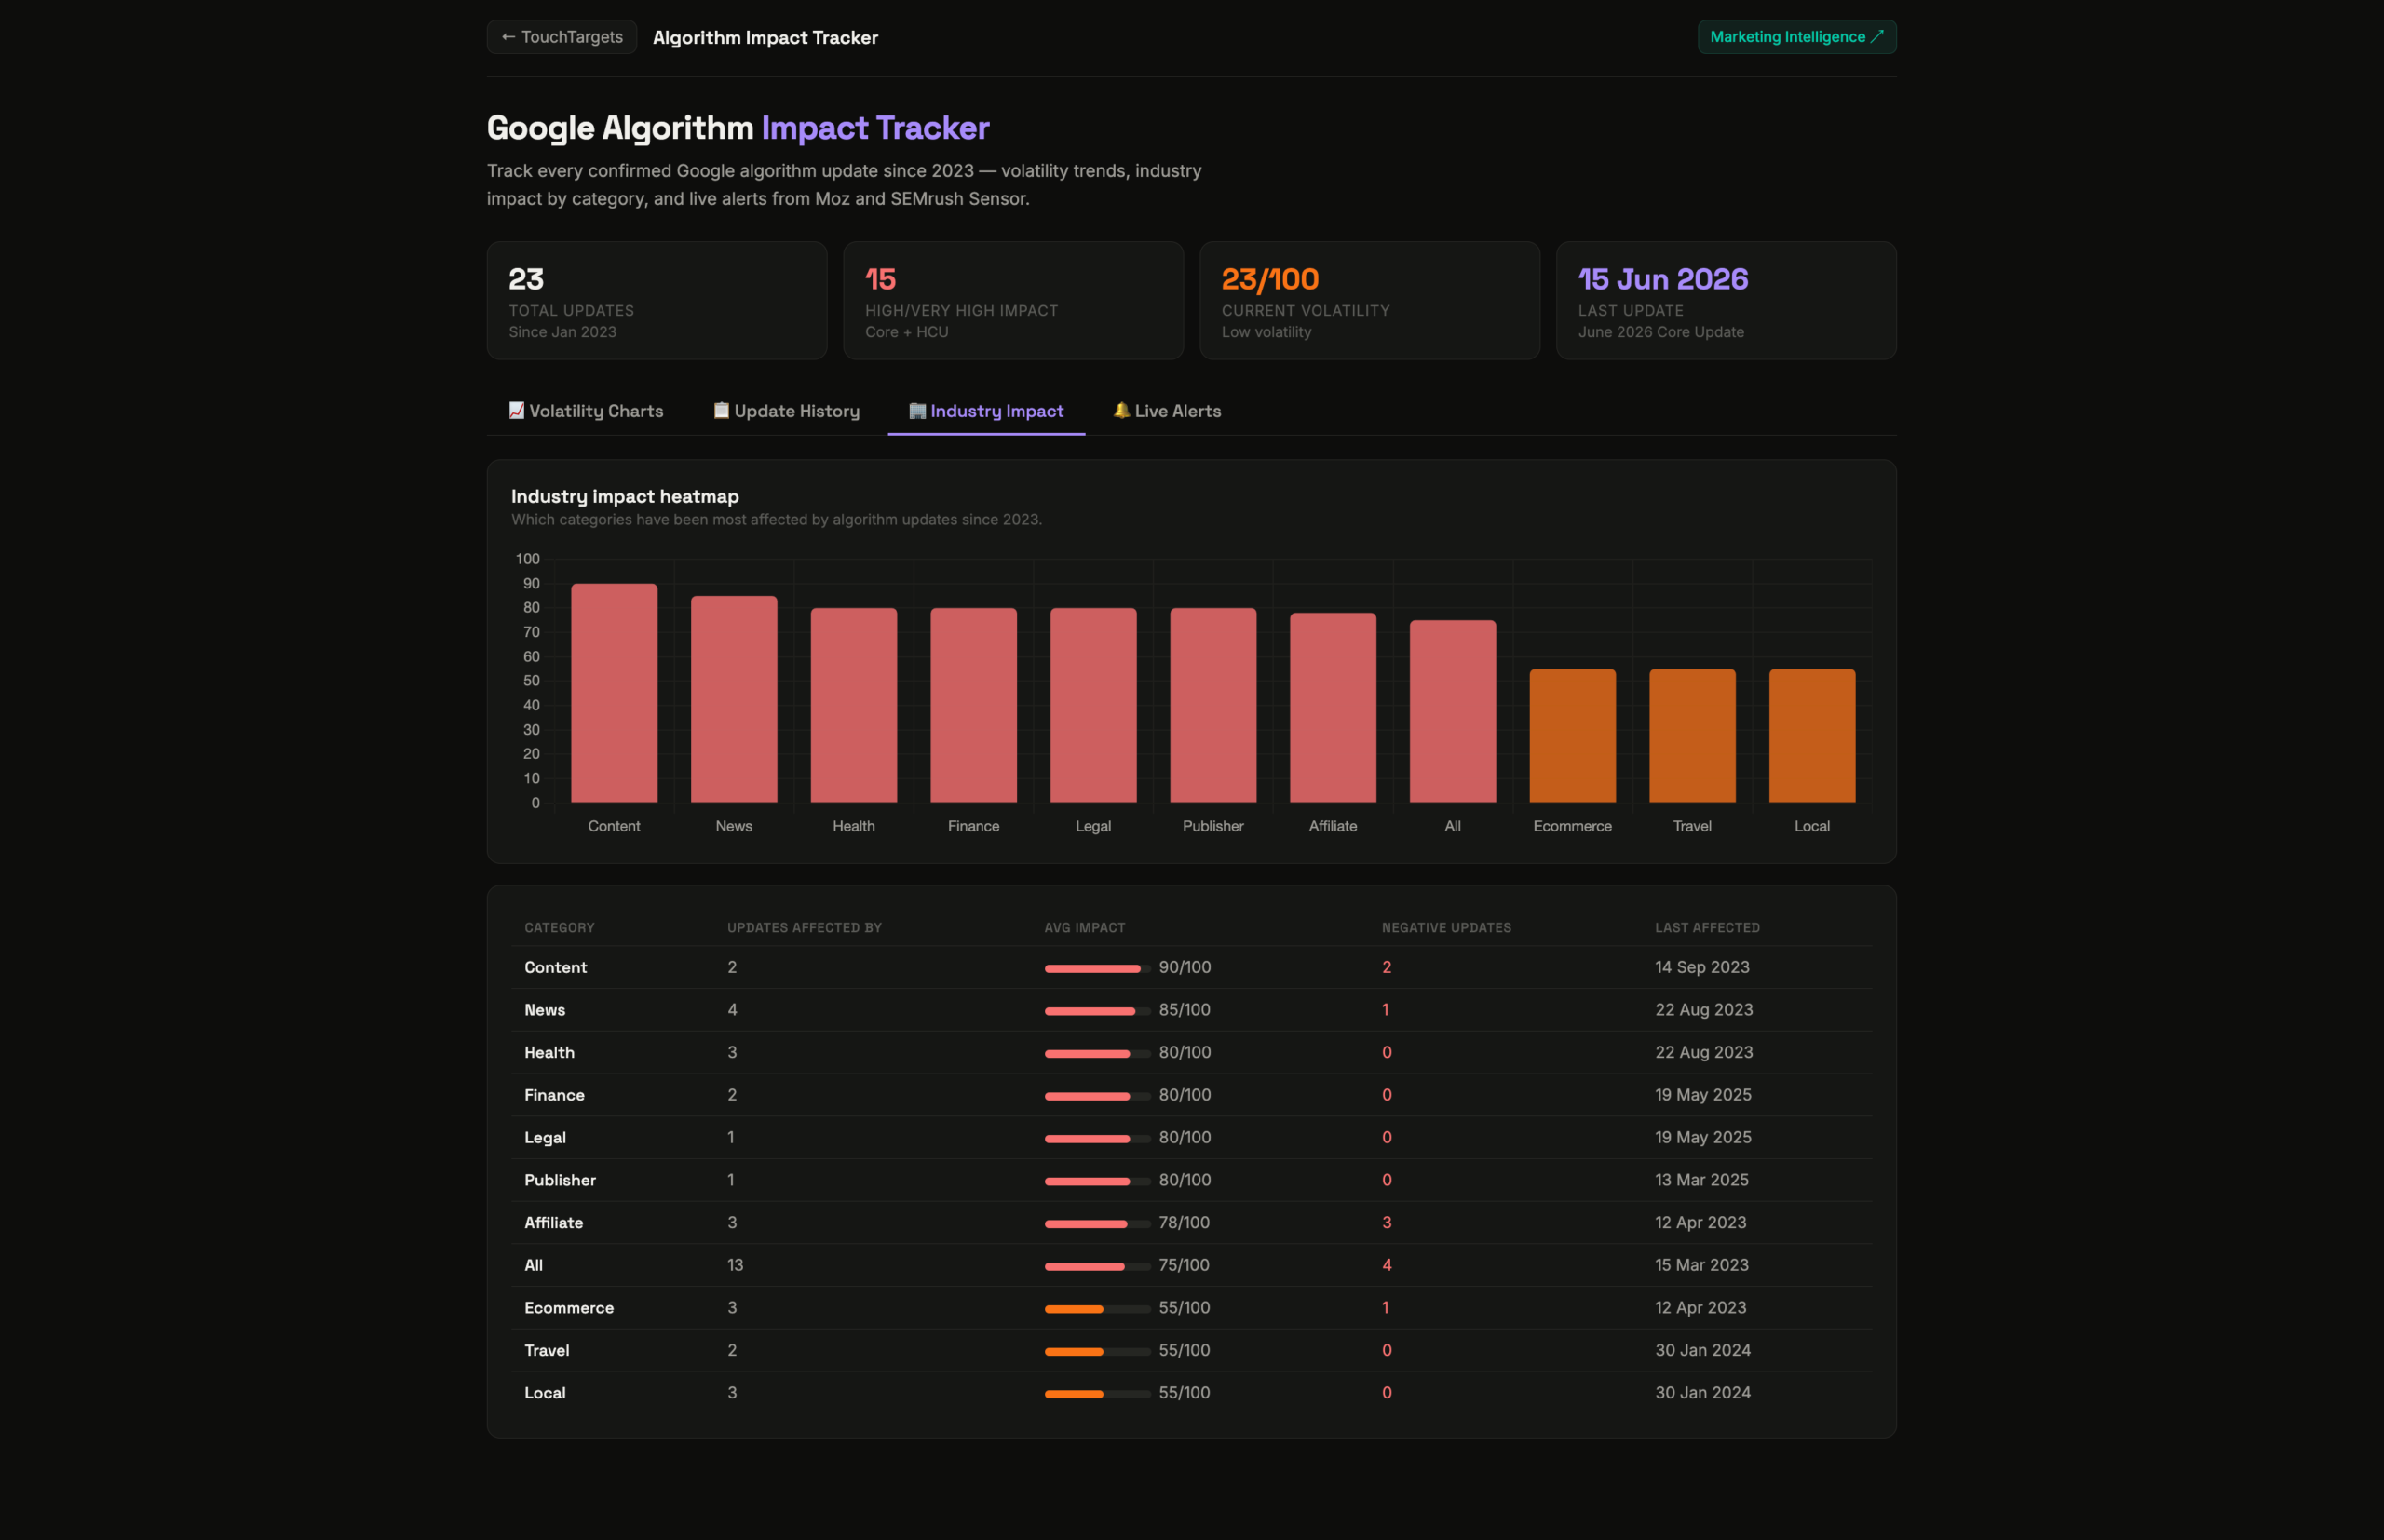
Not every update hits every industry equally – a health update barely touches an ecommerce store, and vice versa. This tab answers “which kinds of sites get hit the most?” It has two parts:
- A bar chart ranking content categories (news, health, finance, ecommerce, and so on) by how hard they’ve been hit on average across all updates.
- A table below with the detail per category: how many updates affected it, its average impact score, how many of those were negative, and the date it was last affected.
Find your own industry in the table. If you’re in one of the high-impact categories (health, finance and news are classic examples, because Google holds them to a higher standard), you’ll know to watch this tool closely after every core update and to keep your content quality especially tight.
5. Tab 4 – Live Alerts
The other tabs are history; this one is the present. It shows a live feed of update chatter pulled from ranking-tracking tools like Moz and SEMrush Sensor, so you often hear that something is happening within hours – before Google even confirms it. Two side panels support it:
- How to use this tracker – a short refresher on what each tab is for.
- Recovery checklist – a practical list of what to do if an update hurt you (see the next section).
6. If an update hurt your rankings: the recovery checklist
When you suspect an update cost you traffic, don’t panic-change everything. Work through these in order:
- Confirm it was an update. Note the date your traffic dropped and check the volatility chart for that day. A clear spike means the whole landscape moved – reassuring, because it means the drop probably isn’t a technical bug on your side.
- Identify which update. Open Update History, filter to that year, and find the update around that date. Read what it targeted and its direction.
- Check your industry. In Industry Impact, see how your category typically fares with that type of update.
- Audit content quality. For core and helpful-content updates, the fix is almost always better, more genuinely useful content – not tricks. Look for thin, outdated or duplicate pages.
- Check the technical basics. Fix Core Web Vitals (page speed and stability), and review Google Search Console for coverage or manual-action issues.
- Be patient. Recovery from a core update often only comes with the next core update, once your improvements have been assessed. Make real changes, then wait.
7. How to use it as an ongoing habit
- After any confirmed core update, open the tool, read the update card, and check your industry’s exposure.
- If you see a drop in your own analytics, always check the volatility chart for that date before assuming it’s your fault.
- Glance at Current volatility now and then; a rising number is your early warning that a rollout may be underway.
Tip: as a rule of thumb, volatility scores above about 60 mean the results are genuinely unstable. If you see a big red spike on the same day your own rankings shifted, that’s a strong sign an algorithm update – not something you did – was the cause.
Open the Algorithm Tracker